- Dartmouth College
- robert.w.bliss@gmail.com
- Github

Math Art
Below is a collection of pretty math images that I’ve created.
Random redistricting
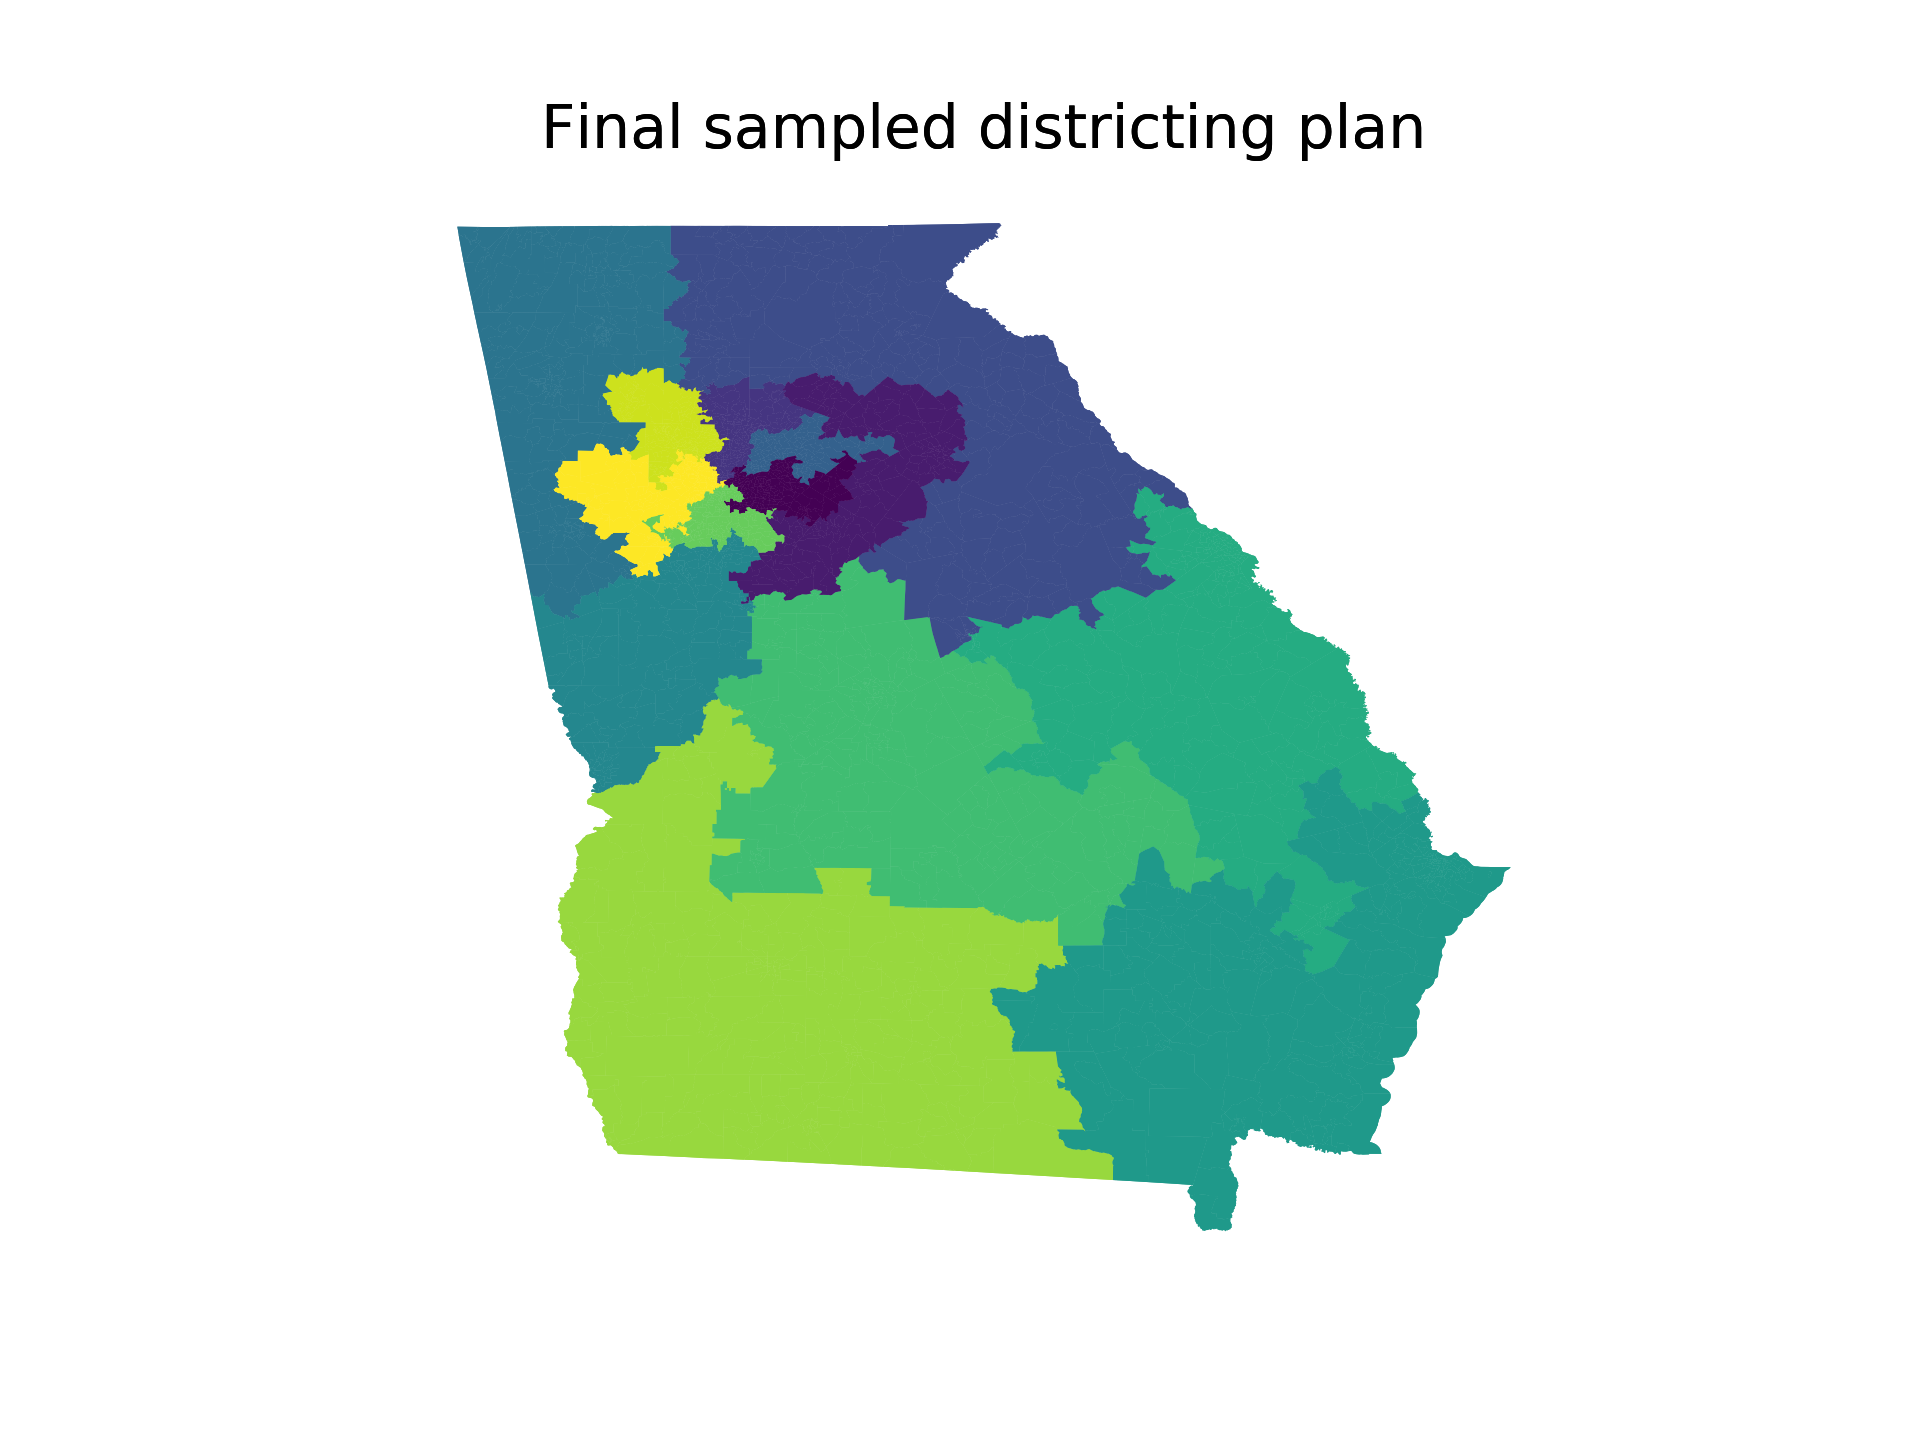
This is a randomly drawn congressional map of Georgia using GerryChain, a tool I helped create at the 2018 Voting Rights Data Institute. I don’t think it solves gerrymandering, but it sure is pretty.
Random number generation with C-finite sequences
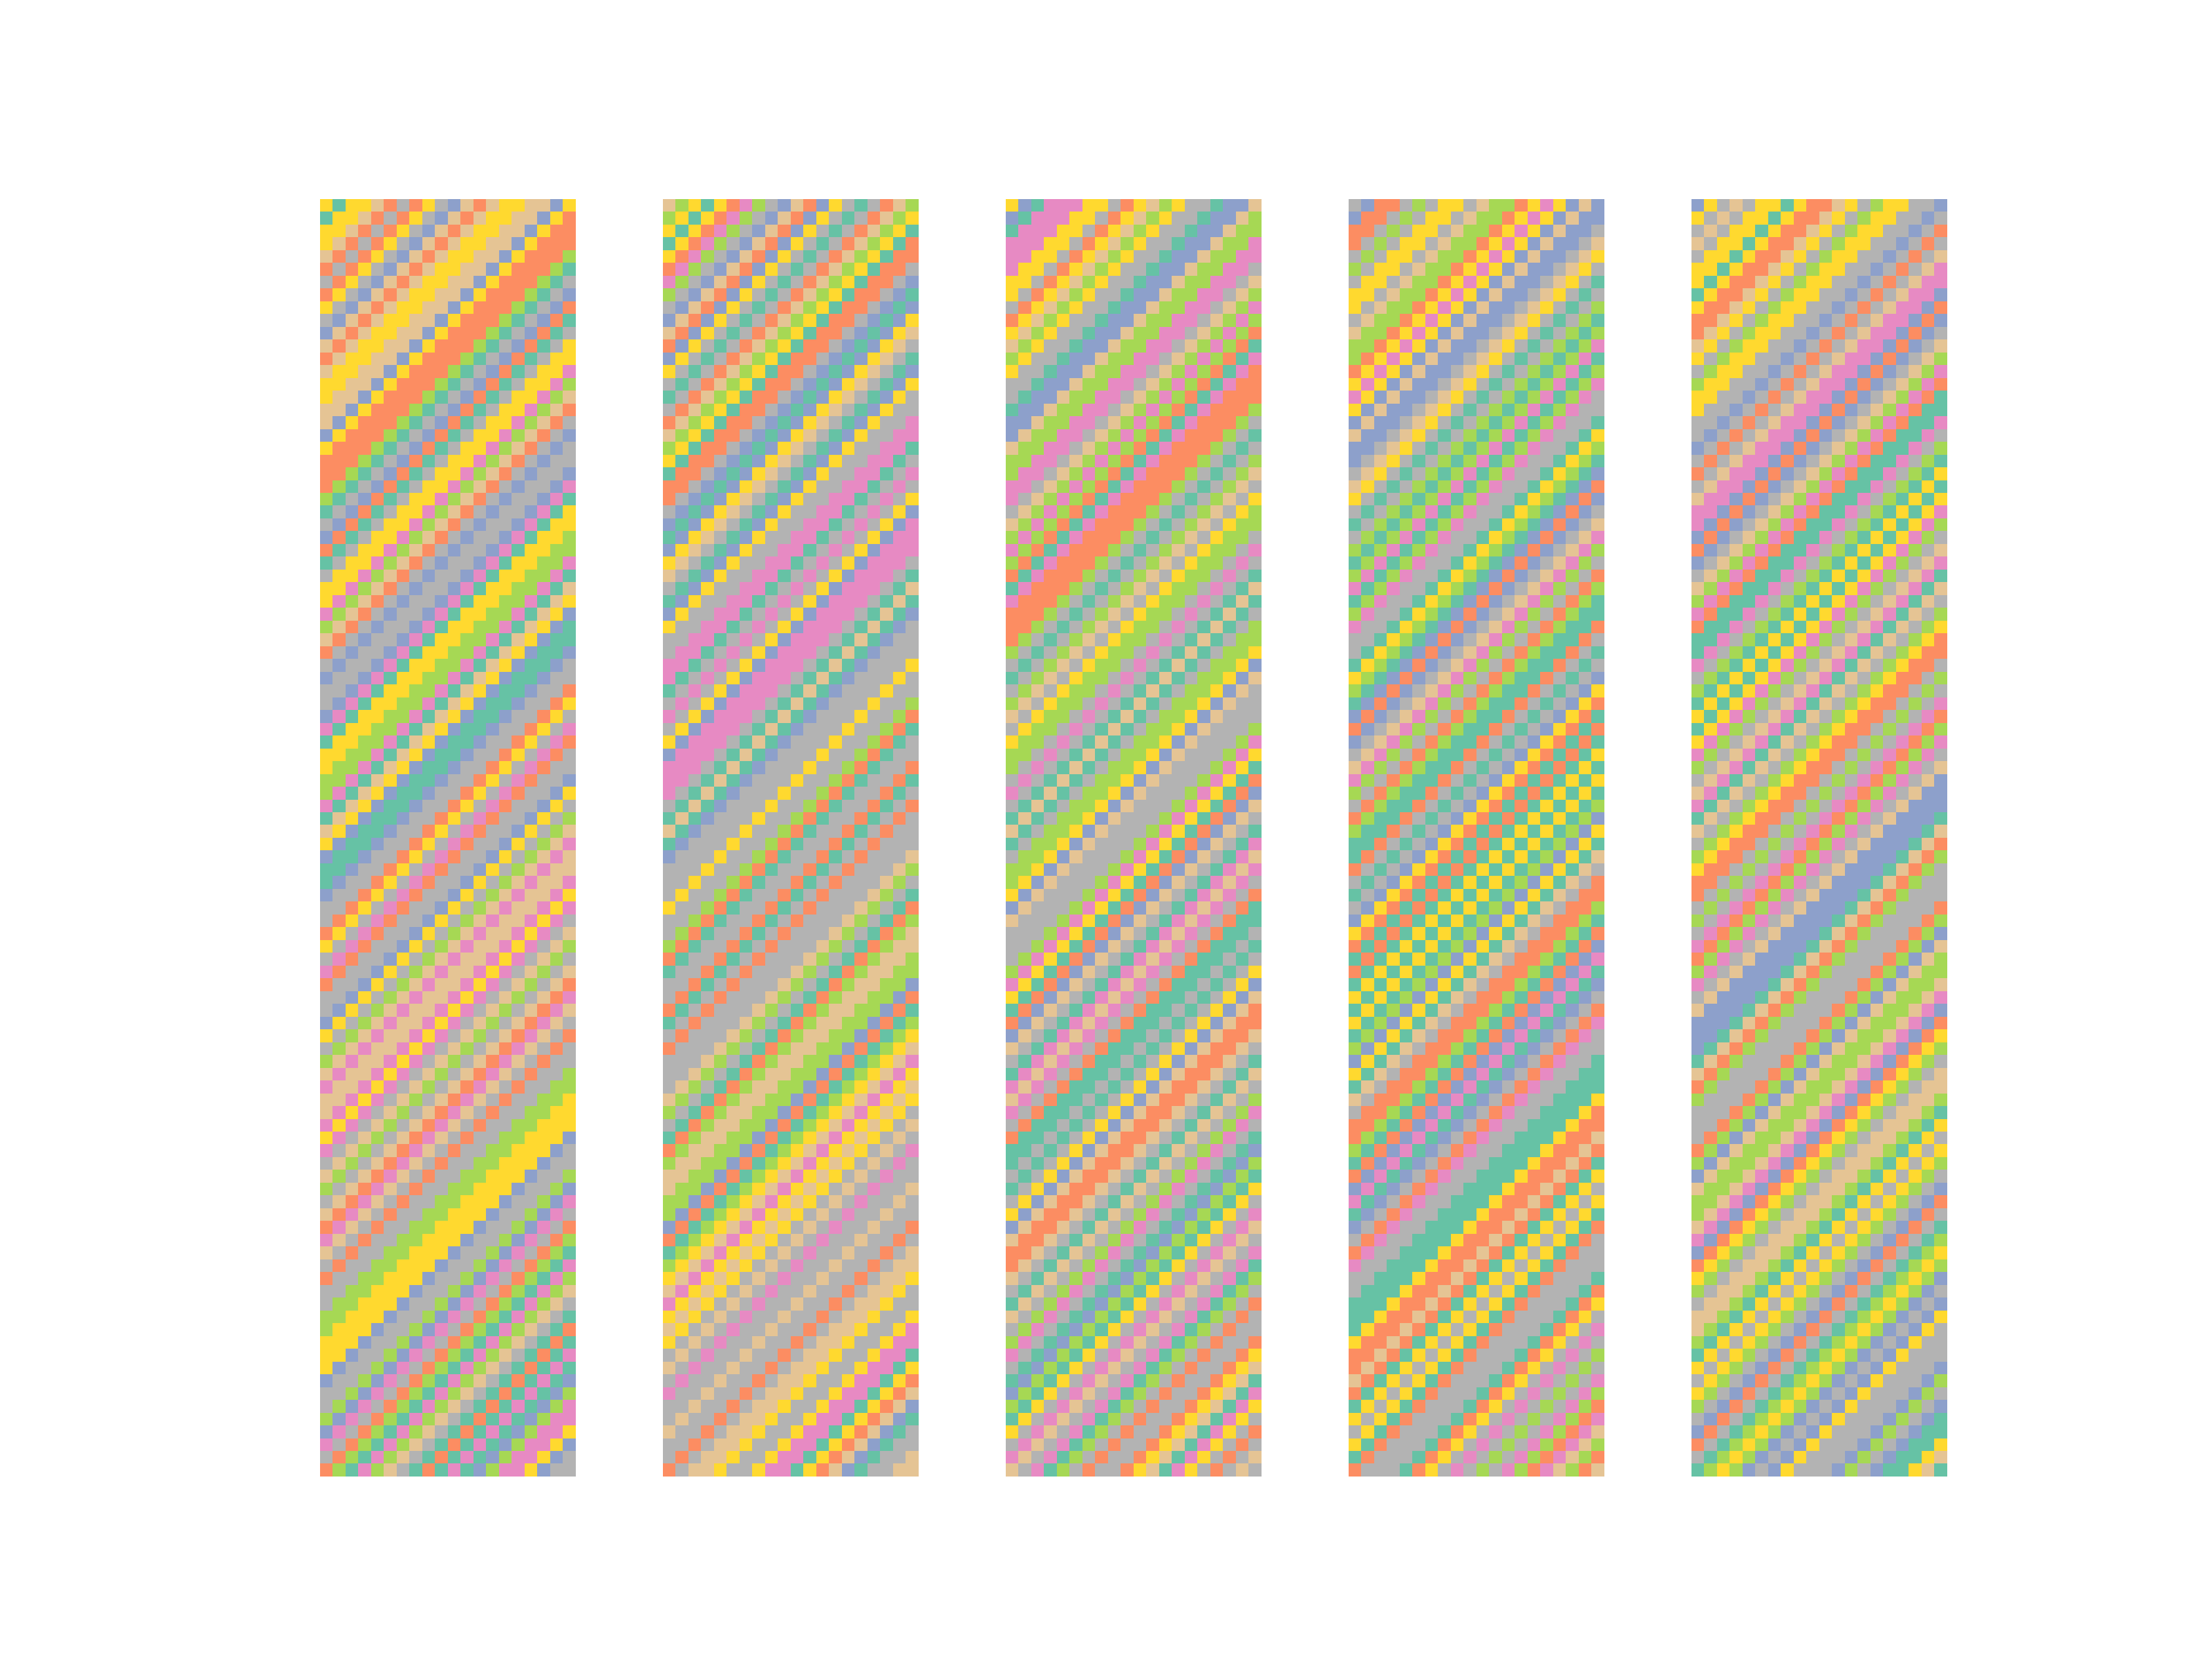
This is a visualization of five linear feedback shift registers mod 9, which is a fancy way to say “some C-finite sequences evaluated mod 9.” I don’t remember the recurrences or initial conditions, but it should be easy to replicate this by just making some things up.
Dyadically resolving graphs
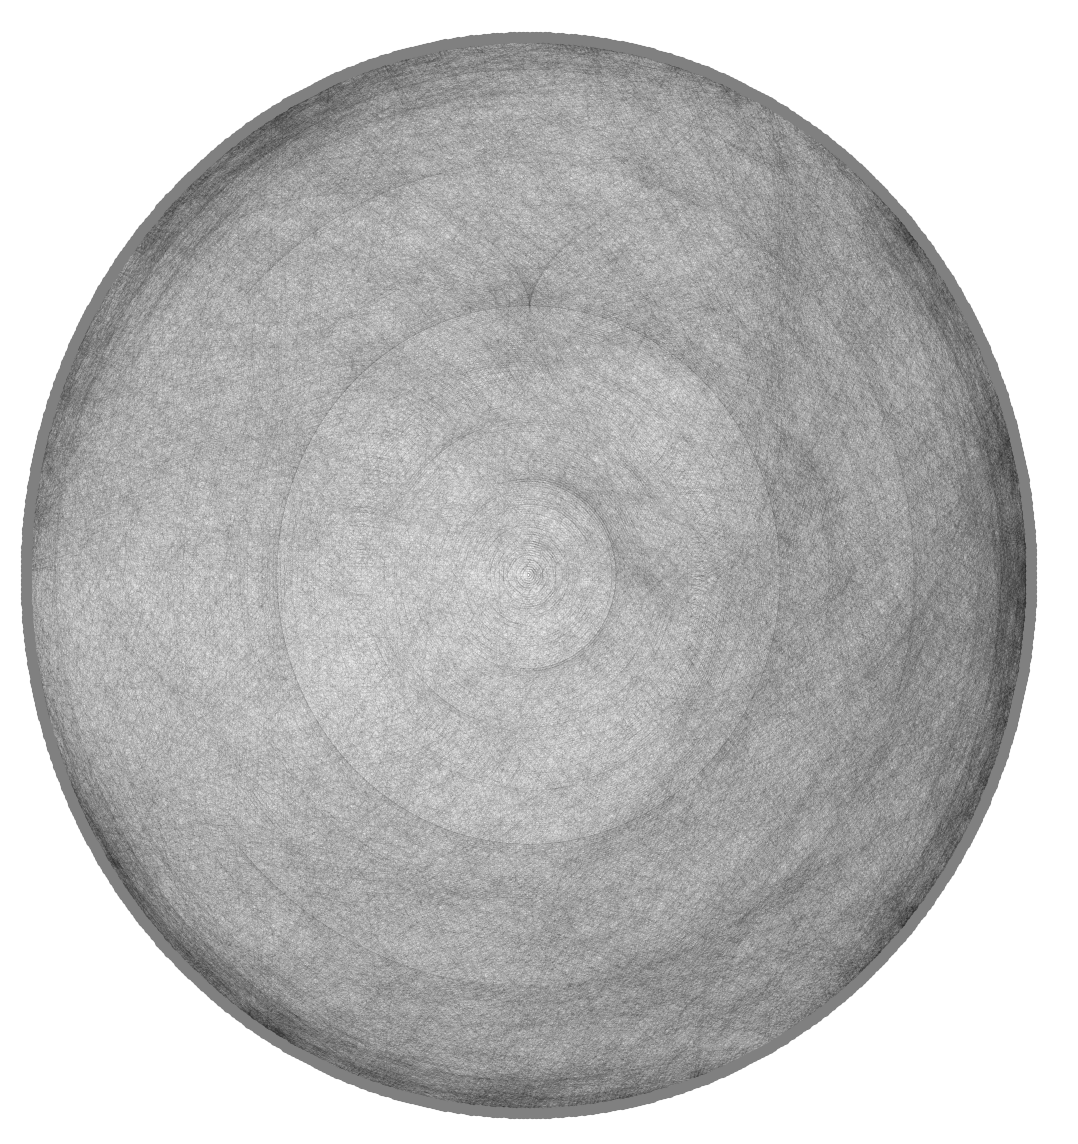
This is a graph whose vertices are all monic, integer-coefficient, degree 6 polynomials with coefficients $\pm 1$ or $0$, and with an edge between $f$ and $g$ if and only if the resultant of $f$ and $g$ is a signed power of 2. It’s a really amazing picture, and I don’t know why it looks like that.
Clustered roots
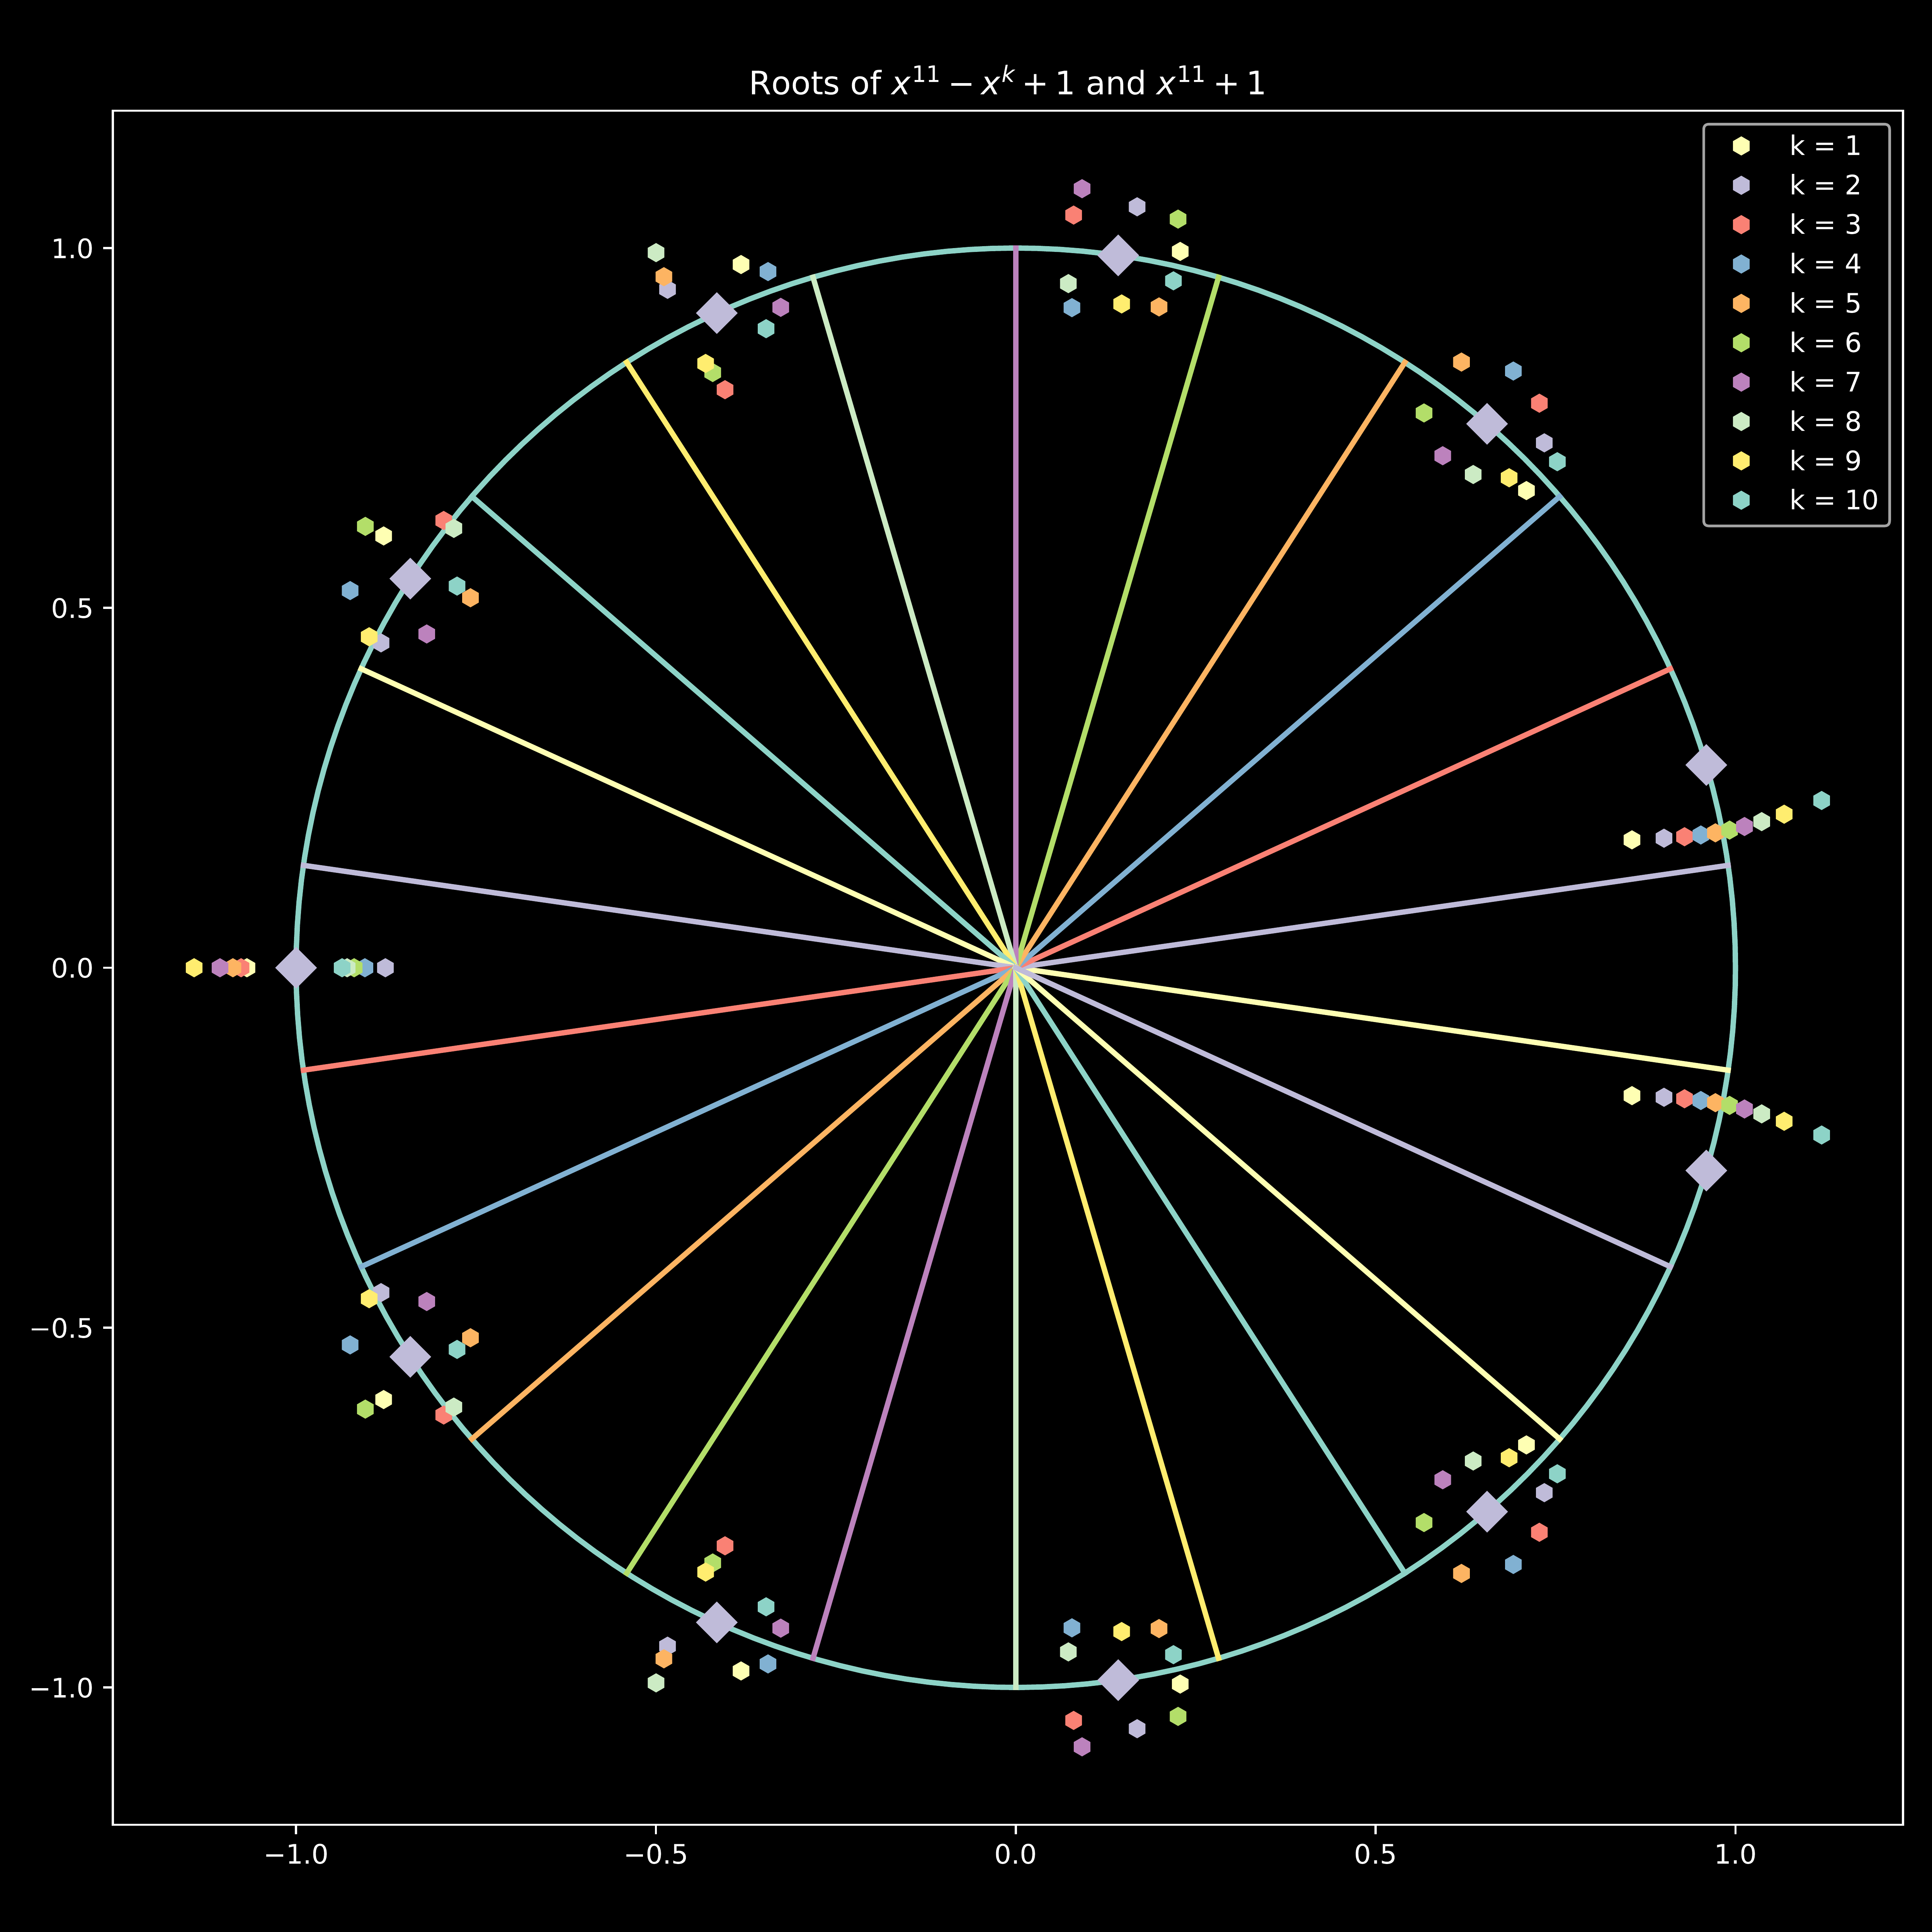
This is a drawing of the roots of $x^{11} + 1$—the 11th roots of -1—and the trinomials $x^{11} - x^k + 1$ for $k = 1, 2, \dots, 10$. The diamonds are the roots of $x^{11} + 1$, and the hexagons are the other roots. Notice that the trinomial roots cluster around the roots of $-1$, and that they “orbit” around them as they traverse the unit circle counterclockwise. This was really surprising to me.
Poisson cities
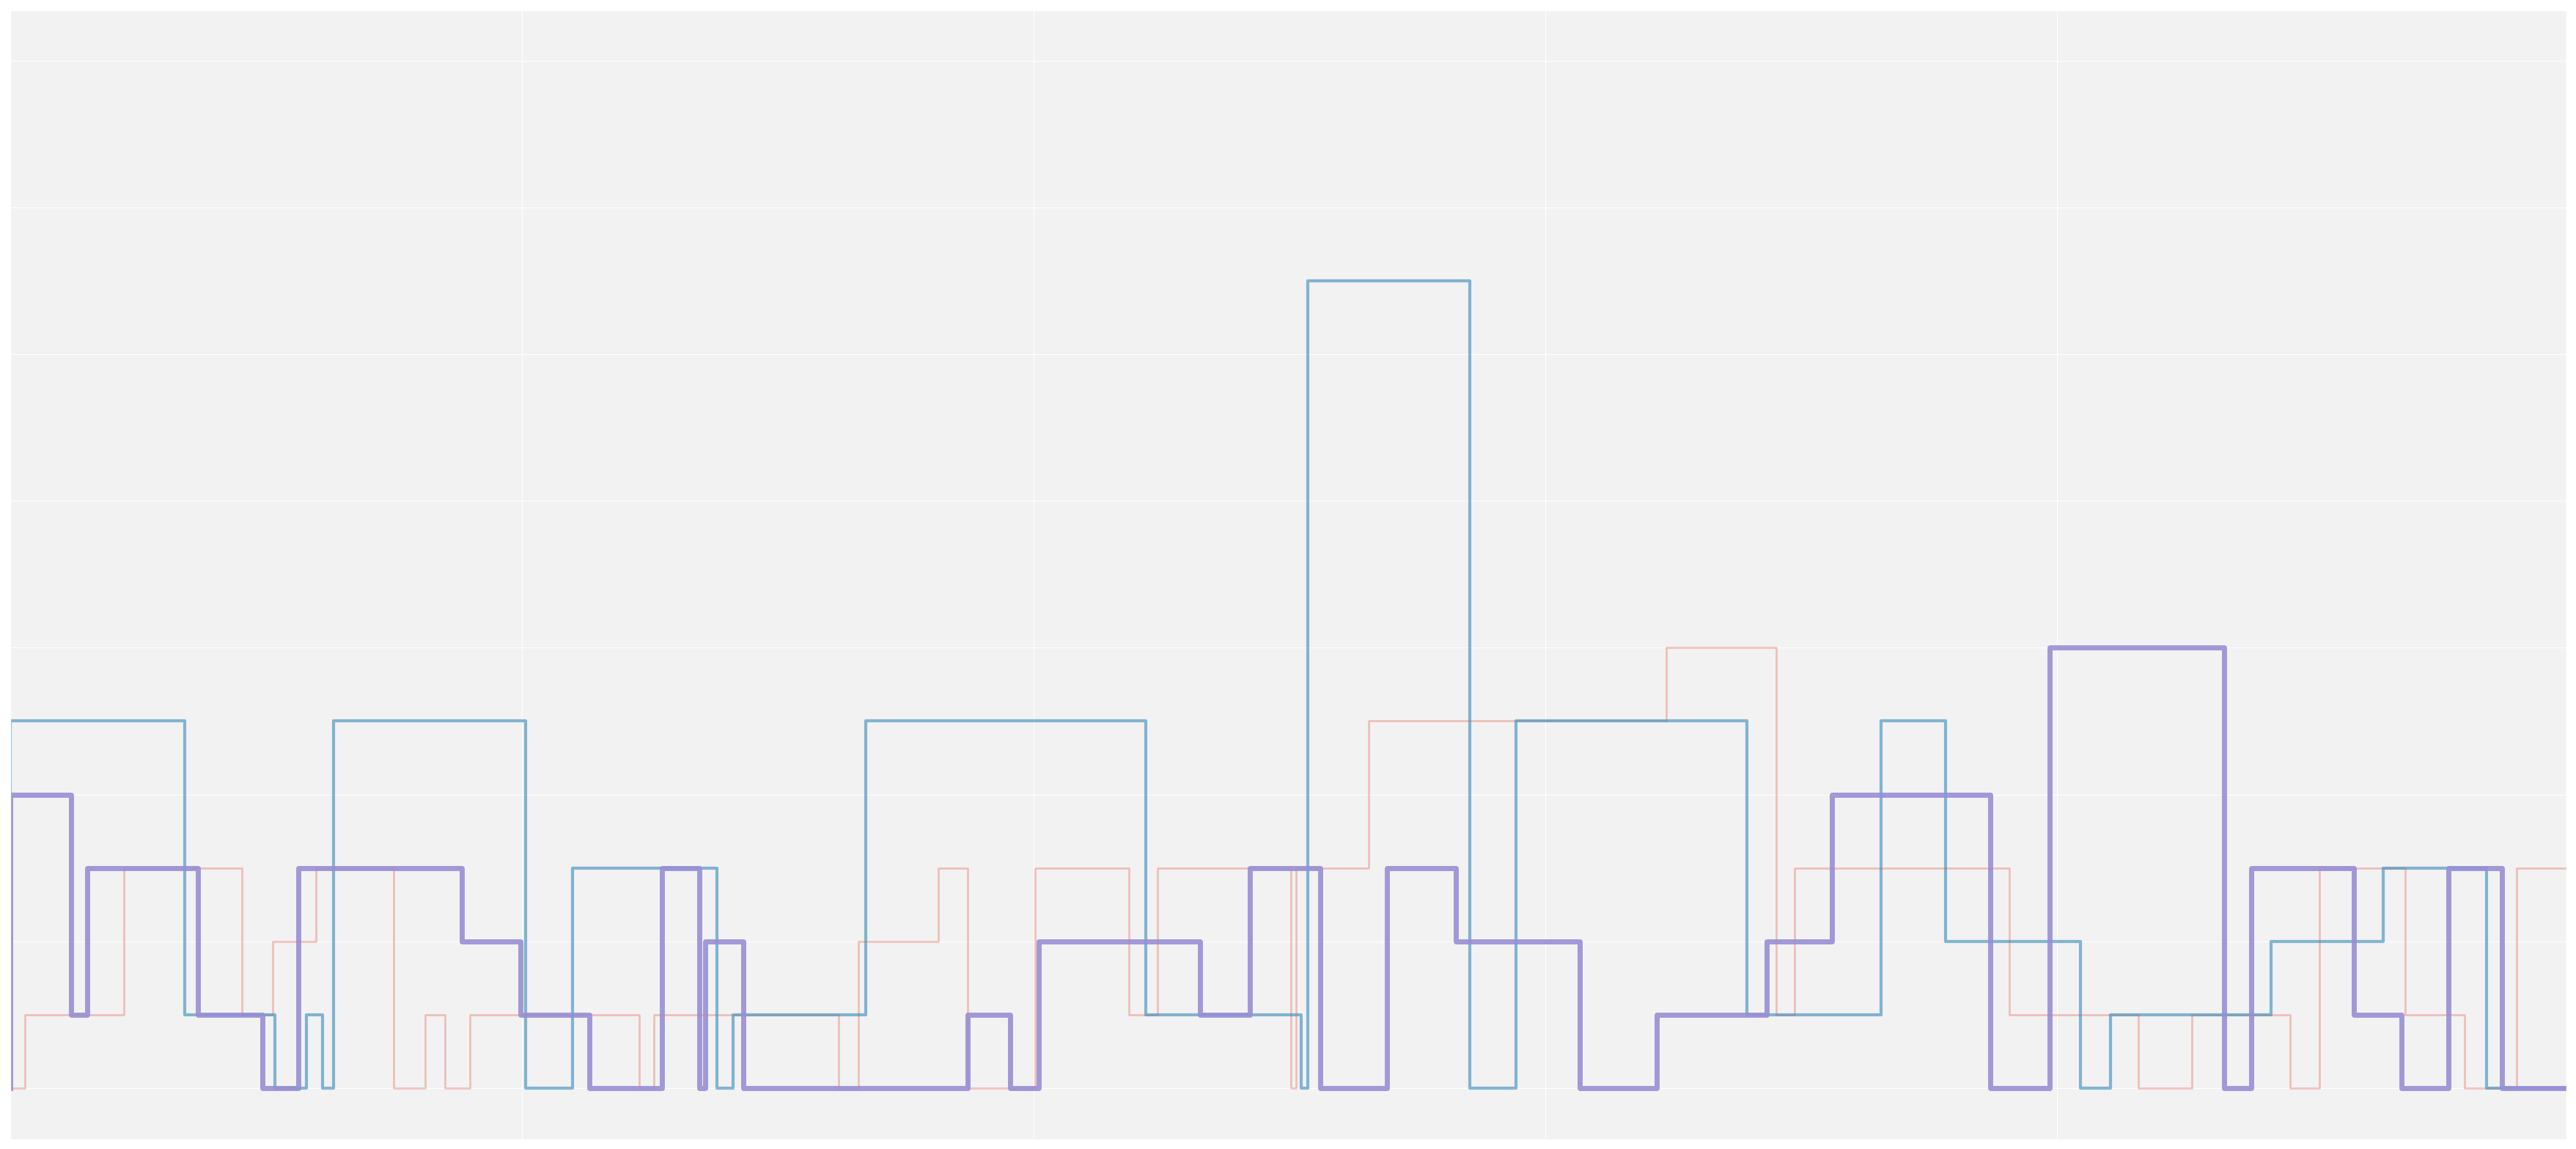
I was trying to simulate the Poisson process but screwed it up. The picture should look like a jagged, ascending staircase, but I forgot to sum the results up, giving what looks like the skyline of a blocky city. I thought this was cooler than whatever I was trying to do.